大屏单块模板组件
原创大约 2 分钟
大屏单块模板组件

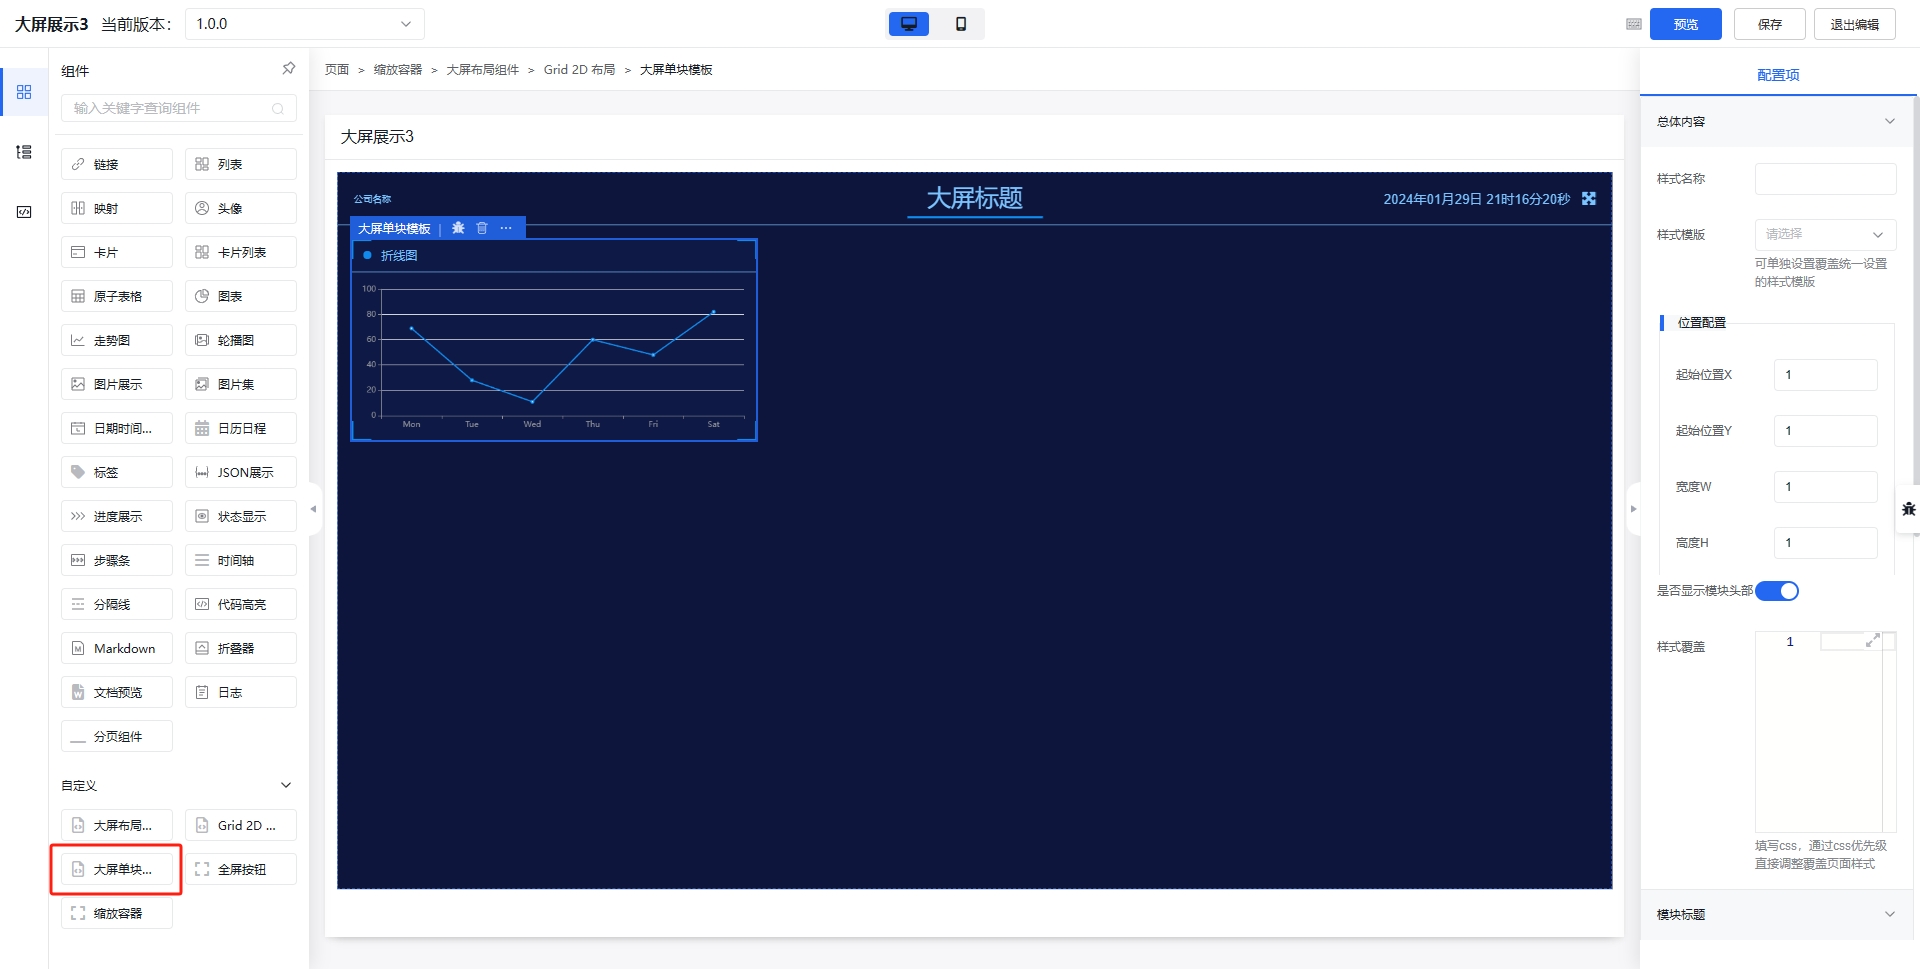
总体内容
| 名称 | 字段 | 用途 | 默认值 | 类型 |
|---|---|---|---|---|
| 样式名称 | className | 定义样式,配置在fan-screen-cardDOM元素上 | - | string |
| 样式模版 | classStyle | 大屏单块模板的样式模版 | - | string |
| 位置配置 | x/y/h/w | 位置配置 | 1 | number |
| 是否显示头部 | headerShow | 是否显示头部 | true | boolean |
| 样式覆盖 | layoutStyle | 填写css,通过css优先级直接调整覆盖页面样式 | - |
样式覆盖 layoutStyle
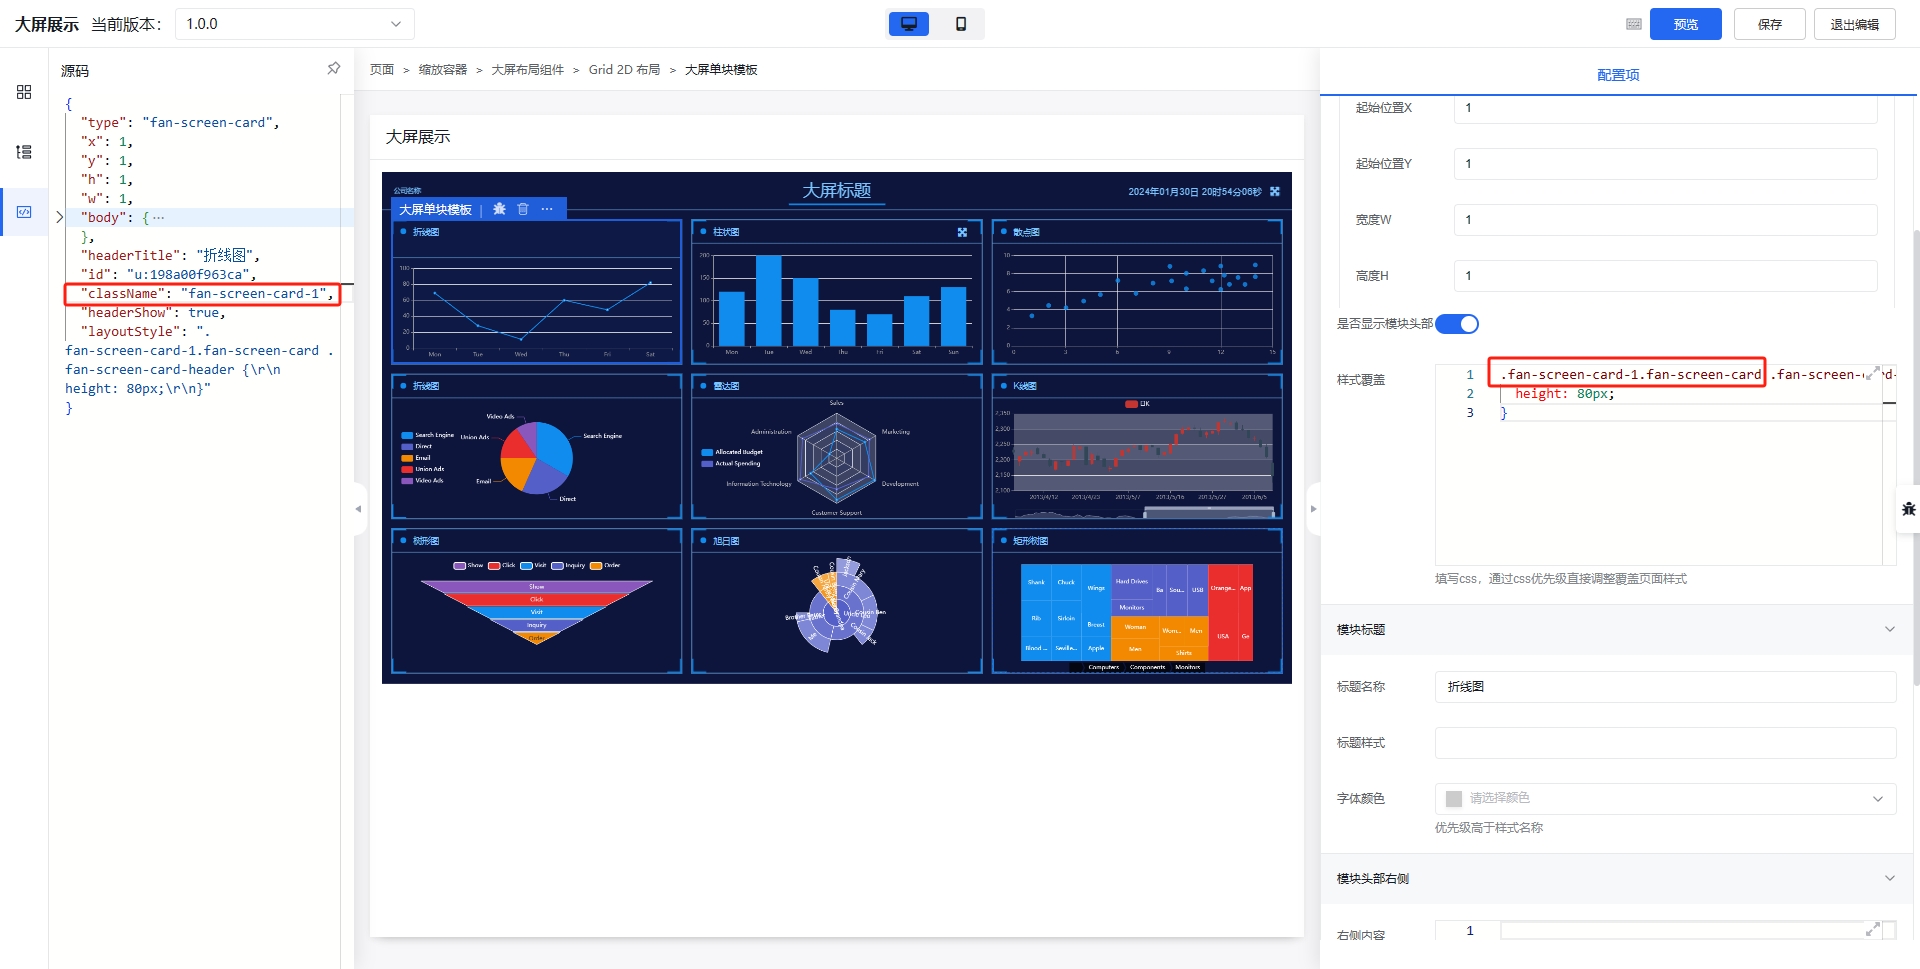
样式覆盖 layoutStyle 是通过css优先级直接调整覆盖页面样式,例如:
.fan-screen-card .fan-screen-card-header {
  height: 80px;
}
此时模块头部的高度将由默认的 50px 调整为 80px 。 css 会作用于符合 css 的所有DOM元素,如果需要唯一设置,请在前面添加特殊的前缀,例如:

.fan-screen-card-1.fan-screen-card .fan-screen-card-header {
  height: 80px;
}
模块标题配置
| 名称 | 字段 | 用途 | 默认值 | 类型 |
|---|---|---|---|---|
| 标题名称 | headerTitle | 标题名称 | - | string |
| 标题样式 | headerTitleClassName | 定义样式,配置在fan-screen-card-header_titleDOM元素上 | - | string |
| 字体颜色 | fontColor | 字体颜色,默认从 ./layout.md#总体配置 继承 | - | string |
头部右侧
| 名称 | 字段 | 用途 | 默认值 | 类型 |
|---|---|---|---|---|
| 右侧内容 | headerRight | 头部右侧,配置schemanode | - | json |
| 样式名称 | headerRightClassName | 定义样式,配置在fan-screen-card-header_rightDOM元素上 | - | string |
内容配置
| 名称 | 字段 | 用途 | 默认值 | 类型 |
|---|---|---|---|---|
| 样式名称 | bodyClassName | 定义样式,配置在fan-screen-card-bodyDOM元素上 | - | string |
| 内边距 | bodyPaddingSize | 定义内边距,优先级高于样式名称 | - | number |
大屏单块模板内容
大屏单块模板内容首先嵌套 Service 功能型容器 用于获取数据,再使用 Chart 图表 进行图表渲染。
如果需要轮流高亮 Chart 图表的每个数据,例如 大屏动态展示 可以使用如下配置:
- 在 Chart 图表 上添加唯一的
className; - 配置 Chart 图表的
config; - 配置 Chart 图表的
dataFilter
dataFilter:
const curFlag = 'lineCharts';

if (window.fanEchartsIntervals && window.fanEchartsIntervals.get(curFlag)) {
  clearInterval(window.fanEchartsIntervals.get(curFlag)[0]);
  window.fanEchartsIntervals.get(curFlag)[1] && window.fanEchartsIntervals.get(curFlag)[1].dispose();
}

const myChart = echarts.init(document.getElementsByClassName(curFlag)[0]);
let currentIndex = -1;
myChart.setOption({
  ...config,
  series: [
    {
      ...config.series[0],
      data: data.line
    }
  ]
});
const interval = setInterval(function () {
  const dataLen = data.line.length;
  // 取消之前高亮的图形
  myChart.dispatchAction({
    type: 'downplay',
    seriesIndex: 0,
    dataIndex: currentIndex
  });
  currentIndex = (currentIndex + 1) % dataLen;
  // 高亮当前图形
  myChart.dispatchAction({
    type: 'highlight',
    seriesIndex: 0,
    dataIndex: currentIndex
  });
  // 显示 tooltip
  myChart.dispatchAction({
    type: 'showTip',
    seriesIndex: 0,
    dataIndex: currentIndex
  });
}, 1000);

if (window.fanEchartsIntervals) {
  window.fanEchartsIntervals.set(curFlag, [interval, myChart]);
} else {
  window.fanEchartsIntervals = new Map();
  window.fanEchartsIntervals.set(curFlag, [interval, myChart]);
}

return config;
修改高亮行 1 curFlag 设置为对应的 Chart 图表的 className,12-17 行是插入数据,22-39 为对应数据的切换展示方式。